Williamburg_VA_Logo

The city leaders of Williamsburg, Virginia had a problem. Their government data platform couldn’t tie critical initiatives to specific KPIs, which meant they couldn't see how their efforts impacted resident satisfaction.

mySidewalk gave them the transparency they needed. Now any citizen or council member can see exactly what the city is working on, and why it matters.

Their mySidewalk City Performance dashboard visualizes which efforts are moving the needle and how residents feel about each piece of the puzzle. 

Williamsburg mySidewalk Success
  • 360 view of key initiatives and how they influence resident satisfaction
  • One-stop-shop for information, stakeholders can quickly find answers to any question 
  • Critical insights into City KPIs such as successes and areas for growth 
  • No longer need to hunt down department heads for information or project updates 
  • Access to local data they didn’t know they had, as well as state and federal datasets
"What would I say to someone who was on the fence about mySidewalk? I'd tell them that the insights this platform provides are invaluable. It will give you data you didn’t even know you had. mySidewalk has been a true partner. They’ve helped us convey the value of our work, and give meaning and context to our data. mySidewalk is just as invested in city management as any of the public servants I know."

Mark Barham Information Technology Director at the City of Williamsburg

Mark Barham


The Problem 

Every city management team wants to provide transparency for their community, to show what they’re working on and why it matters. But for the city of Williamsburg, Virginia, their current government data platform just wasn’t cutting it. 

Williamsburg wanted to tell the story of how they were improving their city, specifically how key initiatives were impacting resident satisfaction. The challenge was, while their government data management system allowed them to build various charts and graphs, it couldn’t help them communicate the value of their work.

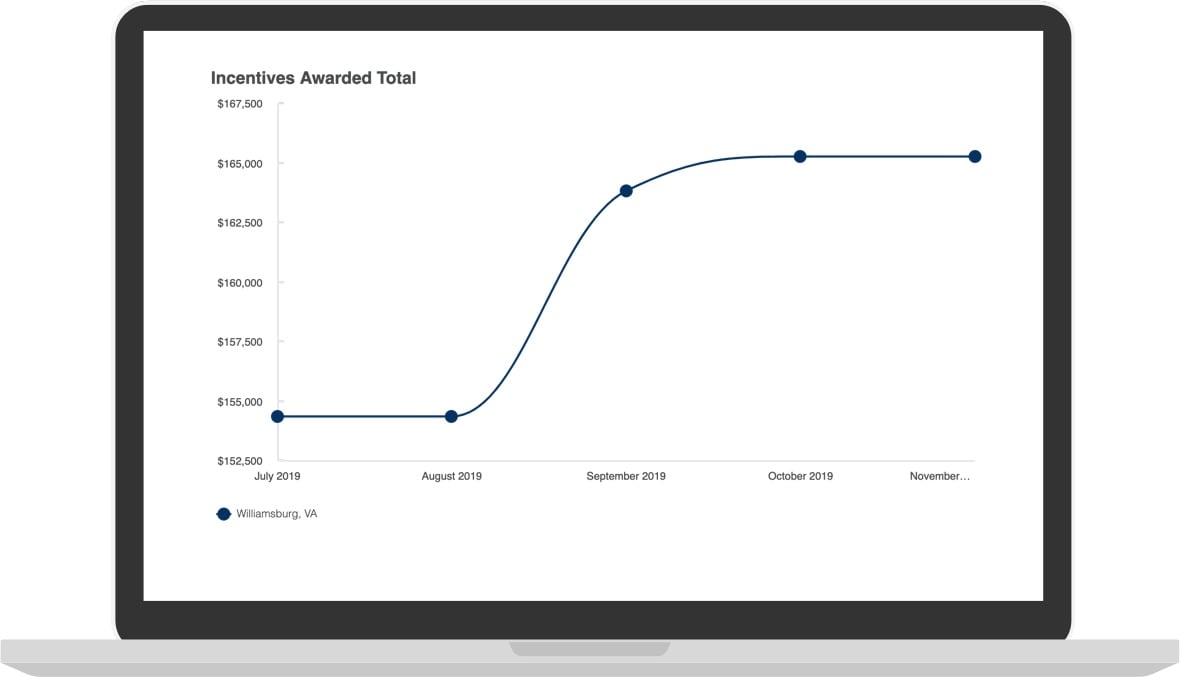
Williamsburg_Incentives

Every couple of years, the Williamsburg City Council set their significant goal areas such as Community Care, Economic Equality, and Citizen Engagement. These mandates set the KPIs for all major projects. Each project was then managed separately by the appropriate department head. Not surprisingly, information was siloed and often out-of-date. 

Adding to the confusion was the fact that Williamsburg had years worth of backlogged data since they completed a National Citizen Survey (NCS) every two years. But no one had the time or resources to build tedious manual reports or track down hundreds of datasets to benchmark their performance. Also, there was no real way to publish that data, other than putting together a 150-page PDF on the website, which of course, no one would ever read. 

The result was that Williamsburg struggled to calculate the return on their efforts. When residents or city council members had a question, they scrambled to find the right department head, and get a project status. The city's Executive Team knew they wanted a better way to measure City Council Strategic Plan progress, but they couldn’t find a solution that fit the bill. 


The Solution

When Williamsburg first heard about mySidewalk, they were intrigued, but when they saw it, they were hooked. As Mark Barham, Information Technology Director at City of Williamsburg put it: 

“We knew mySidewalk was for us as soon as we saw it. With this platform, my Economic Director could suddenly build these complex reports in a matter of minutes, and see all these economic data sets specific to our city, data we didn’t even know we had access to.

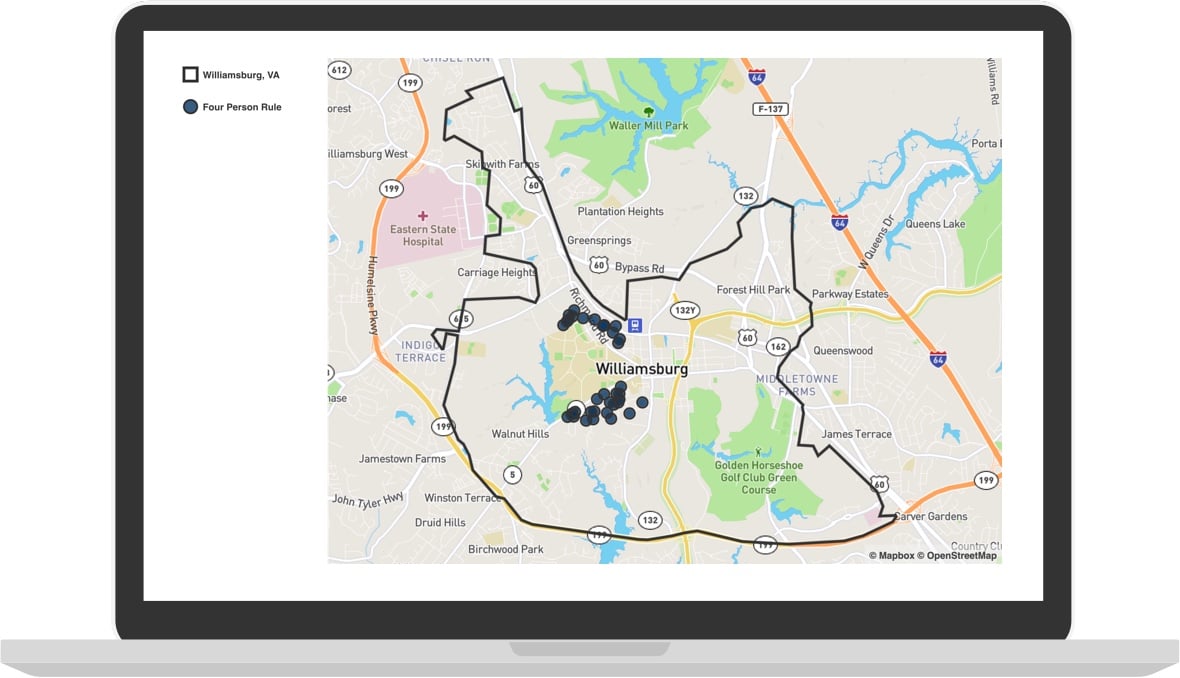
4 Person Map

"It was literally an aha moment for the entire senior staff, the department heads, and our city manager. 

“Not only was the speed at which you could build these reports impressive, but more importantly, we didn’t know we had this data. We were instantly sold. We realized mySidewalk would allow us to compare against a plethora of data sets, adding significantly more context and meaning than if we were analyzing our data on its own.”

Both the skill and complexity of the data analysis were significant factors for Williamsburg in changing its data management tool to mySidewalk. But the deciding factor was the ability to tie their key initiatives to their KPIs. As Barham put it: 

“Our previous government data platform allowed us to build all kinds of charts and graphs, we could make it look really good, but we couldn’t close the loop by tying it to resident satisfaction. 

“Partnering with mySidewalk allows us to say, this is what our council asked us to do, here is where the budget is coming from, and here’s what we’re doing with the funds. Even more importantly, we can now say this is why it matters, and this is how the residents – who are ultimately in charge – feel about our efforts. Being able to tie key initiatives back to resident satisfaction was a game-changer for us."

Another critical consideration in switching to mySidewalk was the amount of preloaded information and the ability to measure against other communities. As Barham said: 

“One of the big reasons we chose mySidewalk were all of these incredible datasets that they provide. The federal and state-level demographic information is so helpful. Our previous tool didn’t offer that kind of out-of-the-box data; we wouldn’t have known where to find it, even if we’d had the time to look – which we didn’t. We love that mySidewalk has it built-in, and it’s automatically updated. 

“We also love being able to benchmark our city to other localities at the state and national level. mySidewalk allows us to do that without having to ask neighboring jurisdictions for comparison data. Our previous system couldn’t provide this kind of depth."

Ultimately, Williamsburg realized to tell the story of their work, it wouldn’t be enough to keep giving stakeholders disjoining charts and reports. They had to close the loop. They needed to communicate why they were doing what they were doing and show how their efforts were moving the needle. They knew that a mySidewalk City Performance dashboard was the right answer. 


The ROI

Williamsburg's initial goal had been to communicate the value of their work.

They wanted to create one centralized place where every stakeholder could find what they needed.

And that’s exactly what happened.

Below is how Barham described Williamsburg’s mySidewalk return on investment: 

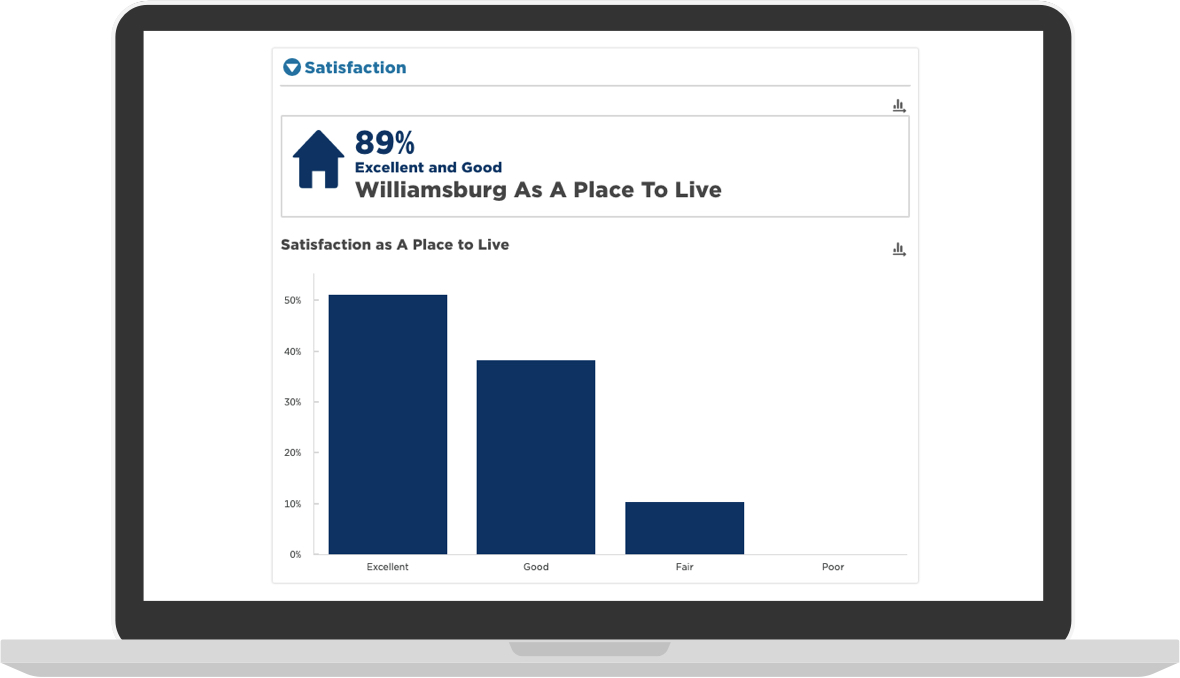
Williamsburg Satisfaction
“I would define our mySidewalk ROI as this. If a citizen or city council member has a question about anything, the answer is in this dashboard. We can now quickly find answers to our most important questions. Our goal of transparency has finally been met.

Mark Barham Information Technology Director at the City of Williamsburg
Mark Barham

“I don’t have to track down project updates anymore, which makes everyone happier, plus it saves time. You can see every initiative, every goal, and the individual steps that it takes to complete that project. You can also easily find a project’s status and its start and end dates. That’s my favorite part. The ability to gain and glean insights from this dashboard is probably the most impressive thing about it. 

“mySidewalk shows us where we’re doing well and where we need to concentrate our efforts and add staff. This level of insight wasn’t even on my radar, because I just didn’t know we could do something like this. I’m beyond thrilled with how our dashboard has turned out. It’s far beyond the realm of what we were initially thinking. We just couldn’t have imagined it.”

However, for Williamsburg, finding the right tool was only half the equation. The other piece was getting the support they needed to implement their new platform. 

“mySidewalk has worked alongside us from the start. I always get a quick response, and every time I talk to the Customer Success team, they’re so genuinely excited to work with me. They haven’t just helped me build a compelling dashboard. They’ve helped us really tell our story.

"That kind of help just goes to show how much time and thought mySidewalk gives its product and its customers. The support has been absolutely phenomenal. I’ve been blown away.” 

Below is a quick video showcasing how the Williamsburg City Council responded to their new dashboard.

mySidewalk is honored to help innovative cities like Williamsburg tell the story of how they’re making their community better. See Williamsburg's dashboard for yourself. Schedule a free consultation to talk to someone about how we can help your city


Explore City Performance Dashboards