.svg "Two-Color-Type-Logo.svg")


Your data joins the conversation
Be among the first to put your organization's data to work in Sidekick.
Your organization has data no one else does.
Most teams are trying to answer one of three questions: Is our work working? Why should it be funded? Are we accountable to our community? Your data show what you did and who you reached. mySidewalk's community data show the need and the conditions around your work.
Until now, your data and the mySidewalk data you trust lived in separate places. Now you can bring your data into Sidekick and work with both in one conversation:
- Chart your results next to community conditions.
- Map your reach against need.
- Spot where your numbers and community trends move together.
Together, your data and our community context make for a more convincing grant narrative, a stronger board update, and a public report your community can follow.
The open beta is for organizations with Sidekick Build. Not sure if that's you? Ask your Customer Success Manager.
What you can do with your data in Sidekick
See your data in community context
Chart and compare your results side by side with mySidewalk's data. Ask in plain language and get answers grounded in both.
Put your data on the map
See the places and service areas behind your numbers, even if you've never mapped them before.
Turn questions into deliverables
Use Ask for quick answers. Use Build when you're ready for a briefing, needs assessment, or report.
Reuse and share your work
Once your data are in a Project, they're ready for the next question, deliverable, and teammate. What you publish is built on mySidewalk's accessibility foundation.
Documents and data: what's the difference?
You may already add documents to Sidekick, like plans, policies, and reports. Sidekick reads them, references them, and uses them as context to shape what it writes.
Your data are different: they provide the numbers Sidekick can analyze, chart, map, and compare with mySidewalk's community data. A document tells Sidekick what your strategic plan says. Your data tell it how many people you served, where, and how that changed. Bring both to the conversation for deeper analysis and more compelling storytelling.
What this looks like in your work
A few ways teams pair their own data with mySidewalk's community data.
Local government
Resident survey results alongside neighborhood conditions. See where residents' priorities line up with what's happening on the ground, ahead of a council briefing or budget cycle.
Try asking: "Using our attached resident survey and mySidewalk's community data, compare how residents rated housing affordability with renter cost burden by ZIP code. Give me three takeaways for council."
Public health
Local case counts or state health data alongside social and economic conditions. Spot patterns by ZIP code or census tract, and see what else those places have in common.
Try asking: "Map the attached case counts by ZIP code for the past year next to the uninsured rate. Which ZIP codes stand out, and what else do they have in common?"
Nonprofits and community foundations
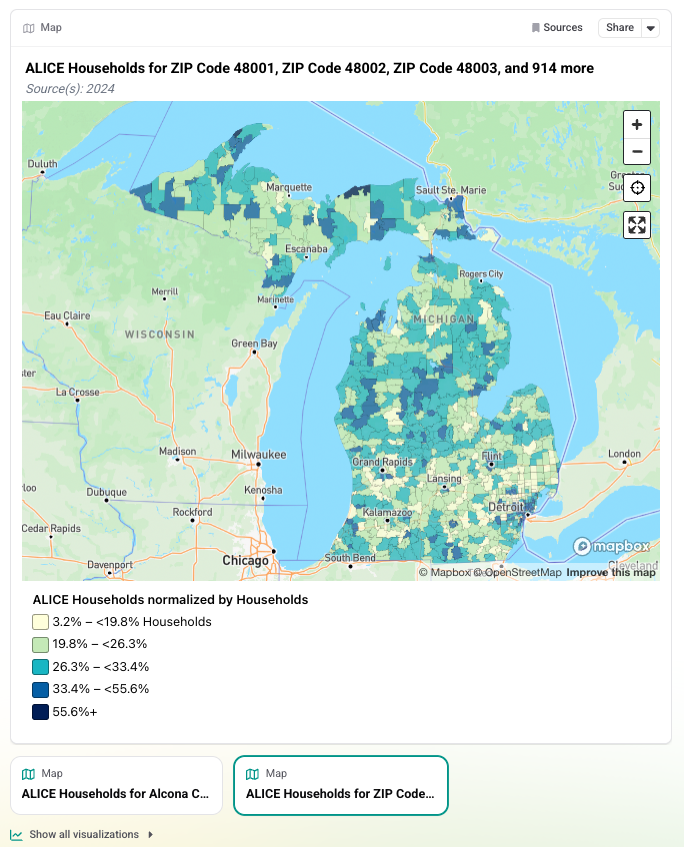
Program enrollment, referral, or ALICE data alongside community need. See whether your services are reaching the people and places that need them most.
Try asking: "Using the attached ALICE dataset and mySidewalk's community data, help me explain financial hardship in Franklin County, Ohio. Identify the years and sources used."
Regional councils
Program surveys or county-level data alongside regional workforce and economic conditions. Compare results across your member counties and see where they differ.
Try asking: "Compare the attached program survey results across our member counties with broadband access and median household income. Draft a one-page summary for our board."
Why join the open beta
The open beta is your chance to use this feature with your own data and provide feedback that shapes future updates.
- Get early access. Bring your data into Sidekick now, before the self-serve version is released.
- Test it on work that matters. Try it on an upcoming grant, board update, or report, and see what's possible with your data alongside ours.
- Work with our team. We prepare your data, and we'll check in once they're ready to help you get started.
- Help set the direction. Tell us what works, what's missing, and what you wish it could do. Your feedback shapes the self-serve version we're building next.
Ready to bring your data in?
You provide the file. Our team prepares it and adds it to a Project in your account. Then you ask and build.
New to this? Watch the short how-to video to see how to find your file and submit it.
- Pick a dataset that matters. Start with the data you keep coming back to, the data people ask you to pull for grants, board updates, and partner reports.
- Submit one file. Use the button on this page, or, from inside mySidewalk, open a Project and select Upload, then Data Submission (Beta). You'll sign in, tell us a little about the data and how you plan to use them, and attach your file.
- Our team prepares your data. We review, clean, and shape them for Sidekick, then add them to a Project in your account.
- Watch your inbox. You'll get an email when your data are ready. If something in the file needs fixing, we'll let you know what to change.
- Ask and Build. Open the Project, attach your dataset to your message in Sidekick, and start asking. When you're ready for a deliverable, switch to Build.
A few things to have ready:
- One file per submission, up to 50 MB. Accepted formats: CSV, Excel, GeoJSON, GeoPackage, KML, GML, SQLite, zipped shapefile, or zipped geodatabase.
- Send the file, not a link. We work from the file you attach, so if your data live on a website or data portal, download them first.
- A little context. The form asks about your data and how you plan to use them.
- Geography helps. Data tied to a county, city, ZIP code, census tract, or service area get the most out of mySidewalk's community data.
- Quarterly or slower updates fit best. A daily or weekly feed isn't the right fit, but a year or two of that history often is.
- No personal information. Don't include personally identifiable information (PII) or protected health information (PHI).
Need more detail? Read Use your data in Sidekick or the full FAQ.
Frequently Asked Questions
If your organization has Sidekick Build, you're already eligible, and you can start bringing your data into Sidekick whenever you're ready.
If you're not sure whether your subscription includes Sidekick Build, or you'd like to add it, reach out to your Customer Success Manager.
Your dataset should connect to a clear geography, such as county, city, ZIP code, census tract, or service area. Common examples include program results, evaluation files, survey responses, service counts, or state datasets.
Your data do not need to be perfect. This beta is about learning what data you want to use alongside our data, what Sidekick can help with today, and where the product roadmap needs to go next.
Do not include personally identifiable information or protected health information in your submission.
Your data are handled with the same security and privacy standards that apply to all mySidewalk products. Your organization owns your data, and they are never used to train AI models. We share your data only with the service providers that host and power Sidekick, such as our cloud and AI providers, and none of them use your data for training.
The data you submit are used only to support your team's analysis. Once our team prepares them, they live in a Project in your organization's account, protected by the same encryption and access controls as everything else in mySidewalk.
During the beta, we may ask for your feedback on how the feature is working, and we'll use what we learn to improve it.
Please don't include personally identifiable information (PII) or protected health information (PHI) in your submission.
Pick a dataset, submit one file, and our team prepares your data and adds them to a Project in your account. You'll get an email when they're ready. See How it works above for each step, or watch the short how-to video to see how to find and submit your file.
Your data live in the Project our team adds them to. Open that Project, attach your dataset to your message in Sidekick, and use them with Ask or Build. During the beta, your data aren't added to your layer library or dashboards, but the charts, maps, and reports you create with them in Sidekick can be saved and shared like any other Sidekick work.
A person on our team prepares every file, so timing depends on the file and what it needs. We'll email you as soon as your data are ready, and we'll reach out sooner if we have questions.
We'll email you to explain what needs to change. Update the file and submit it again the same way. If your data aren't a fit for the beta, we'll explain why, and your Customer Success Manager can help you think through other options.
No. During the beta, your dataset reflects the file you submitted. If you have a new version or spot an error, reach out to your Customer Success Manager.
There's no additional cost. If your organization has Sidekick Build, the open beta is included in your current subscription. If you have questions about your current subscription or beta access, reach out to your Customer Success Manager, who can walk you through the details.
The open beta began in October and will run for a couple of months. During that time, we're building a self-serve way to bring your data into Sidekick, shaped by what we learn from your feedback. We'll share more as it gets closer.
The open beta works best when you have a near-term need, like an upcoming grant application, board report, scorecard, impact update, or public-facing deliverable, and a dataset connected to a clear geography such as county, city, ZIP code, census tract, or service area.
It also helps to have a team member who can submit the file, ask questions and build with the data in Sidekick, and share feedback with us along the way.
Sidekick is built specifically for civic teams who need to combine their own organizational data with trusted community context. Unlike generic AI tools, Sidekick understands which civic data sources to trust, how geography changes the meaning of data, and when a number needs a caveat. Business intelligence tools can store and chart your data, but they are not designed to understand community conditions or help you tell the story behind the numbers. Sidekick supports the full workflow from question to outcome, with traceable sources and human review at the center.
What you gain with your data in Sidekick
Capacity to do more
Stop rebuilding the same tables for every grant, board update, and partner report. Ask once, then build from the answer.
Confidence in defensible data
Your data and ours, with sources you can trace, so you know what every chart and claim is based on.
Clarity about your impact
Connect what your organization did to the conditions around it, in a form your board, funders, and residents can act on.
Bring the data you keep coming back to
Submit one file. Our team prepares it. You ask, explore, and build.