Case Study

Broward Metropolitan Planning Organization

Case Study Header Templates (3)

Before using mySidewalk, the Broward Metropolitan Planning Organization knew their efforts were paying off, they could see the trends in the data, but they struggled to quantify their ROI to their board and community. 

The information on its own was dry. It wasn’t visual or easy to understand, which was critical because stakeholders couldn’t see how funding was directly impacting the success of their initiatives. 

mySidewalk helped them tell a more powerful story that captured and engaged their stakeholders. That same data has been transformed into a dashboard that makes people stop and say, "wow."

Broward’s mySidewalk Success
  • Transformed stale reports into a dashboard that impresses stakeholders
  • Data + storytelling shows how funding impacts the success of key initiatives 
  • The value of the team’s work is showcased in a visual and effective way
  • Managers no longer spend 3-4 hours a week creating reports 
  • Increased transparency and department consensus
"The MPO has been very pleased with its purchase of mySidewalk. Using this tool helps us create better transparency, increase stakeholder buy-in, and saves us several hours a week." 

Paul Flavien The Data Services Manager for the Broward MPO

The Broward Metropolitan Planning Organization can best be described as a highly innovative and strategic MPO. Like any good MPO, their mission as a federally-mandated agency was to create policies that would improve transportation within their county – including Fort Lauderdale, Florida and 30 other municipalities.

Like most MPOs throughout the country, they had to assess myriads of data sets, solve local transportation issues, and decide how to allocate federal funds across the right projects.

Bottom line, Broward MPO had to improve overall mobility for an entire county. 

Broward  MPO + mySidewalk_Example
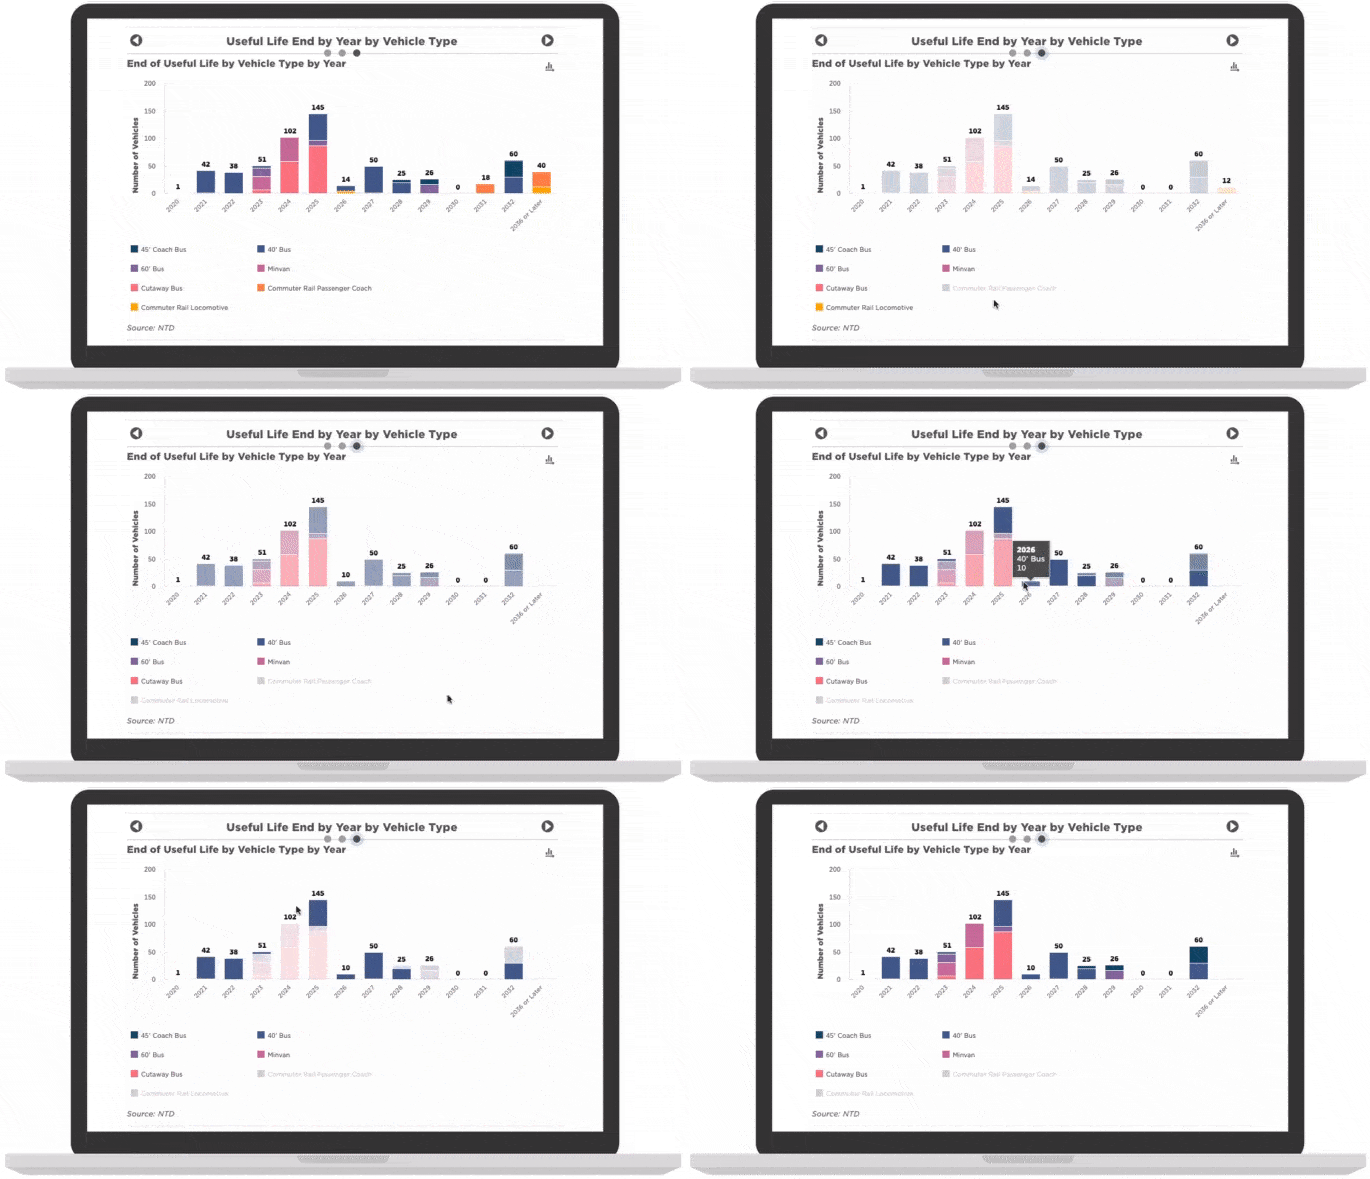
Transit Asset Management should be more than a reporting box to check. By using the age and the useful life of your vehicles, mySidewalk helps you understand when assets will reach the end of their useful life.

No small feat. Furthermore, they had a large board, 25 voting members in all. They were also facing unique challenges, such as explosive population growth.

The Broward MPO was deeply committed not only to their board’s goals but also to those of their community leaders. For example, as a part of their long-range planning efforts, they spent a full 18 months going to homeowners associations, and city commission meetings to better understand local objectives.

They even met one-on-one with every single municipality in the county. The Broward MPO knew this research, while intensive, would be worthwhile. They had learned that creating transparency was a critical measure. Doing so would ensure buy-in from all parties, and would mitigate problems down the road. 

In other words, lack of data was not the problem. In addition to their own impressive research, Broward was juggling several other Transportation Performance Management (TPM) measures data sets, such as county data, crash statistics, route reliability, economic development data, job access, etc.

The problem was engaging stakeholders and the public around important transportation planning issues. The data wasn’t visual or easy to understand. Stakeholders couldn’t see how funding was directly impacting the success of their initiatives, which was critical, because that could influence future policy progression and fund allocation. 

When a board member or community leader asked a question, a scramble was required to find the answer. The MPO leaders spent hours cobbling together charts and reports, only to have their readers’ eyes glaze over when they got them.

They knew they needed a better way to synthesize their data and communicate insights. They needed a compelling story that would prove the value of their work, something that would engage and inspire stakeholders. 


The Solution

As soon as Paul Flavien, the Data Services Manager for the Broward MPO, saw the mySidewalk transportation Performance Management dashboard, he knew they’d found a solution. As he put it: 

“When we saw mySidewalk, we knew we needed it. My team was especially impressed with the transportation templates.

"Before we used mySidewalk, we were at a loss as to how to make our data more engaging. Now it’s the same data, but it’s so much easier to see why it’s important.


Broward  MPO + mySidewalk_Example 2
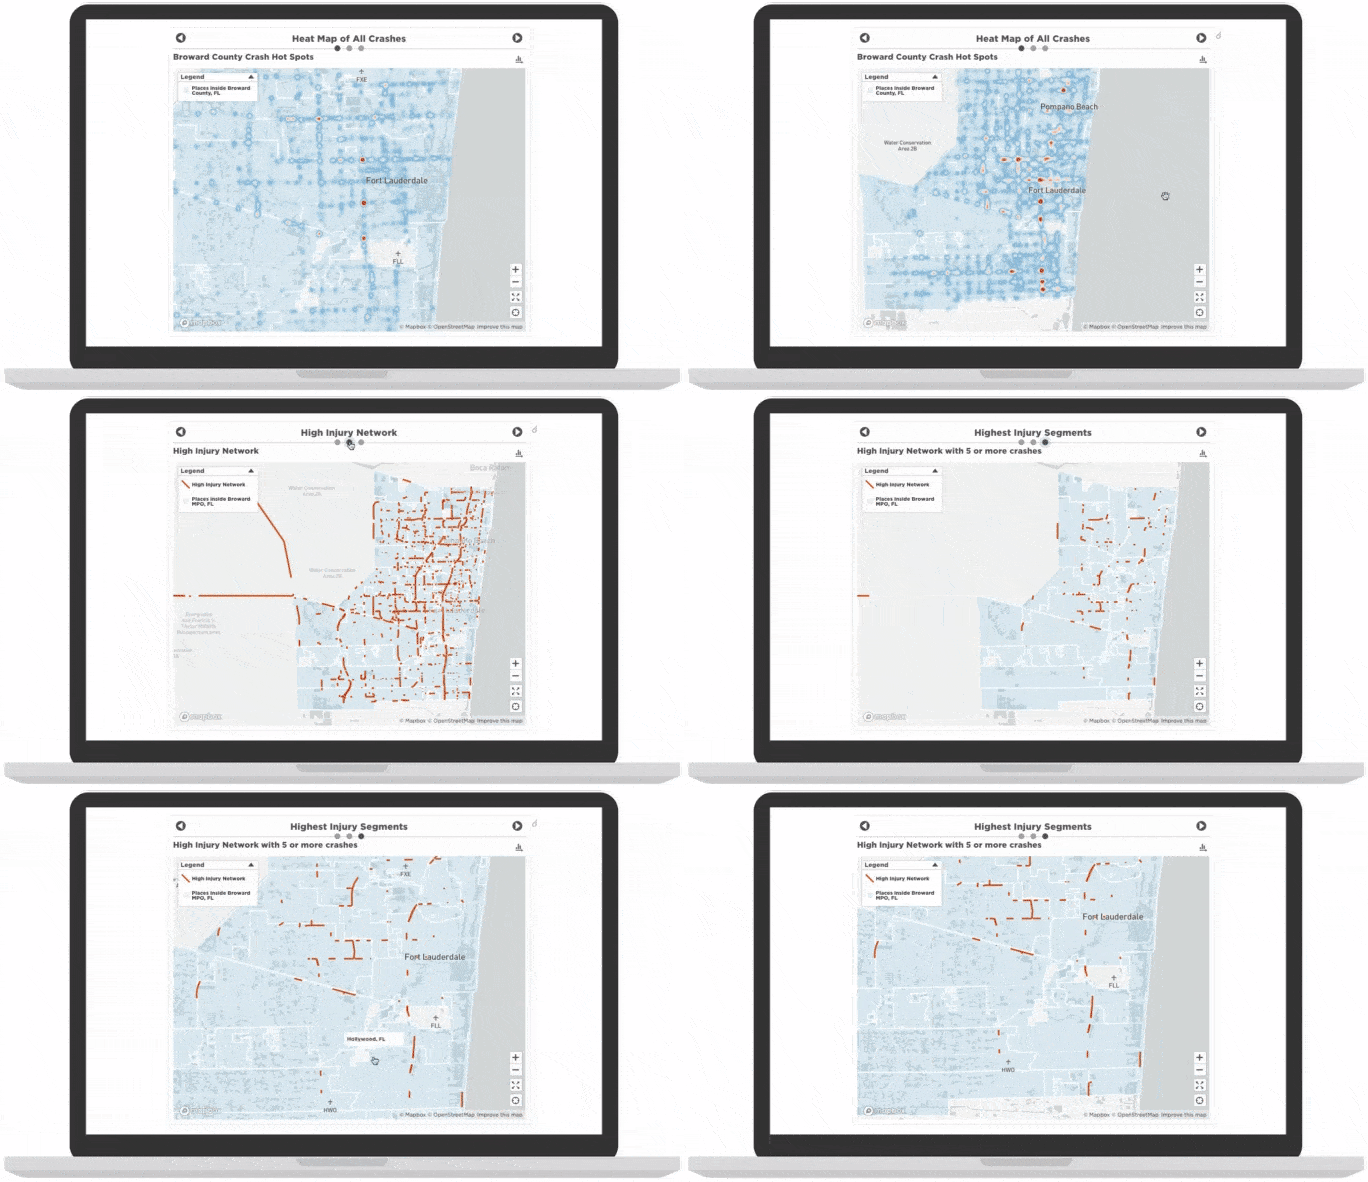
Geospatial analysis changes Vision Zero from a daunting mission to an achievable reality. By creating a High Injury/Fatality network from crash points, Broward found that over half of serious injury and fatal crashes occurred on just 3.5% of its streets as measured by centerline length.

"Before, I could see the trends in our data, but I struggled to convey them to my stakeholders. mySidewalk has made it easy for me to convey those insights to my Technical Advisory Committee and to the public. It helps me show the trends and capture people’s attention. Our Performance dashboard shows a clear snapshot of where we’re at and our progress against our goals. It allows us to present a data-driven approach that builds consensus."

Reporting templates and clean visualizations weren’t the only considerations as Broward contemplated using mySidewalk. Two other key factors were ease of use and report build-time. Both those goals were met.

“Using mySidewalk saves me a lot of time. Before, we’d have to comb spreadsheets, cobble together tables, do whatever we could do to make our reports look good. Now, it’s so simple. 

“Plus, our branded colors are already built-in. It’s just so user-friendly and easy for us to use. We also love that the data is so easy to share and download. Those things are huge value-adds for us.

“Putting together effective reports is one less thing I need to worry about. I used to spend a lot of time answering questions from board members, like how many crashes happen in this place, etc. I’d have to manually compile that data to find the answer. I spent probably 3-4 hours a week doing this, and I’m so glad I don’t have to anymore.”

An additional benefit was mySidewalk’s ability to quickly access, filter, and drill down on public information sets. 

“We use a lot of ACS data, so being able to quickly view current population demographics is amazing. Now, we can quickly and easily display census data tailored to a particular locality."

Ultimately, the Broward MPO decided that their status quo process of compiling data and manual reports wasn’t enough. They realized effective visualizations, aesthetics, and storytelling weren’t a luxury, but a necessity if they wanted to really engage their stakeholders.

It was clear that a mySidewalk transportation Performance Management dashboard was the solution they needed.


The ROI

The primary goal for the Broward MPO had been to engage their stakeholders. To turn dry reports into something meaningful and compelling, that would truly show the value of their work.

According to Flavien, using mySidewalk achieved that mission. Below is how he described their mySidewalk return on investment.

"The MPO has been very pleased with its purchase of mySidewalk. Using this tool helps us create better transparency, increase stakeholder buy-in, and saves us several hours a week." 

"Using this tool helps us create better transparency, increase stakeholder buy-in, and saves us several hours a week. Plus, it looks good, it’s really aesthetically pleasing.

"We love it. I can’t think of anything bad to say about mySidewalk.”

Broward  MPO + mySidewalk_Example 3
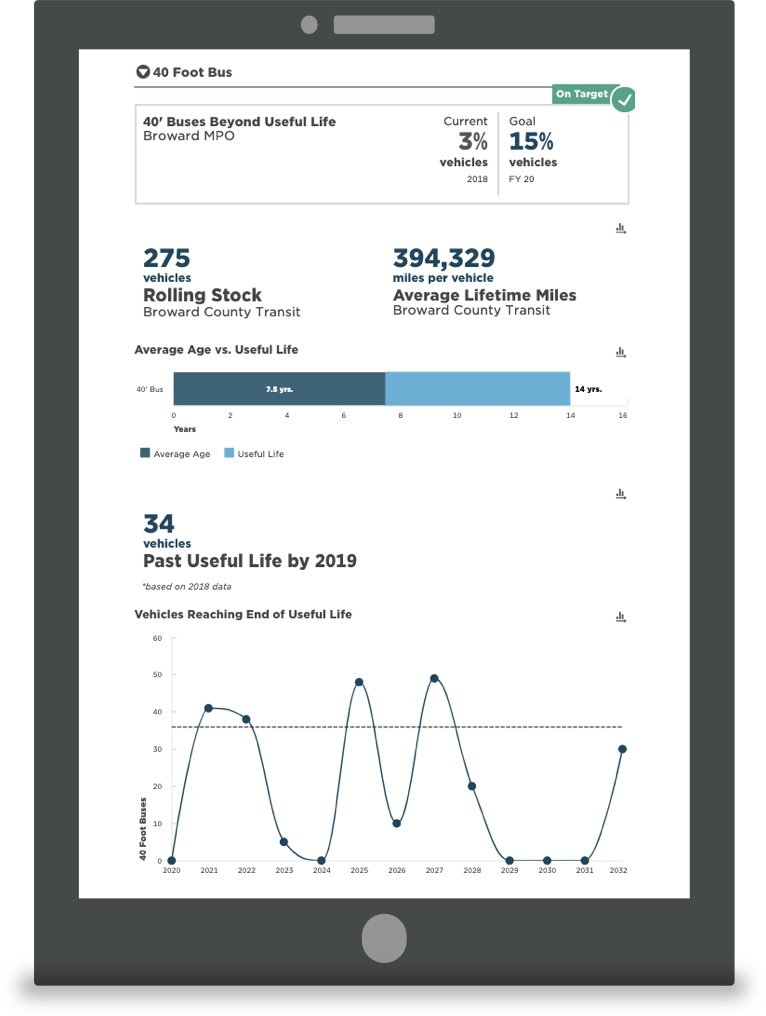
Broward's Transportation Performance Management dashboard makes it easy to track progress against goals.
mySidewalk has helped us even more than I hoped. It makes it easy to track progress against goals, and really engage our stakeholders. I’d define our mySidewalk ROI as taking data that isn’t sexy and making it appealing.
Before mySidewalk, our data was dry and boring, and we were at a loss as to how to make it engaging. Now, with mySidewalk, it’s the same information, but people look at it and say, ‘Wow, this is impressive, I’ll take some time to look at it. It’s so much easier to show the value of our work now."

Paul Flavien The Data Services Manager for the Broward MPO

The Broward MPO found the mySidewalk platform so helpful they took it upon themselves to share it with several colleagues.

"We love mySidewalk so much, we’ve personally demoed it for several industry colleagues.

"Everyone who has seen it has been impressed by it.

"The Performance Dashboard is such a solid product. I just can’t stop singing its praises.

"The mySidewalk team has been amazing to work with, as well.”

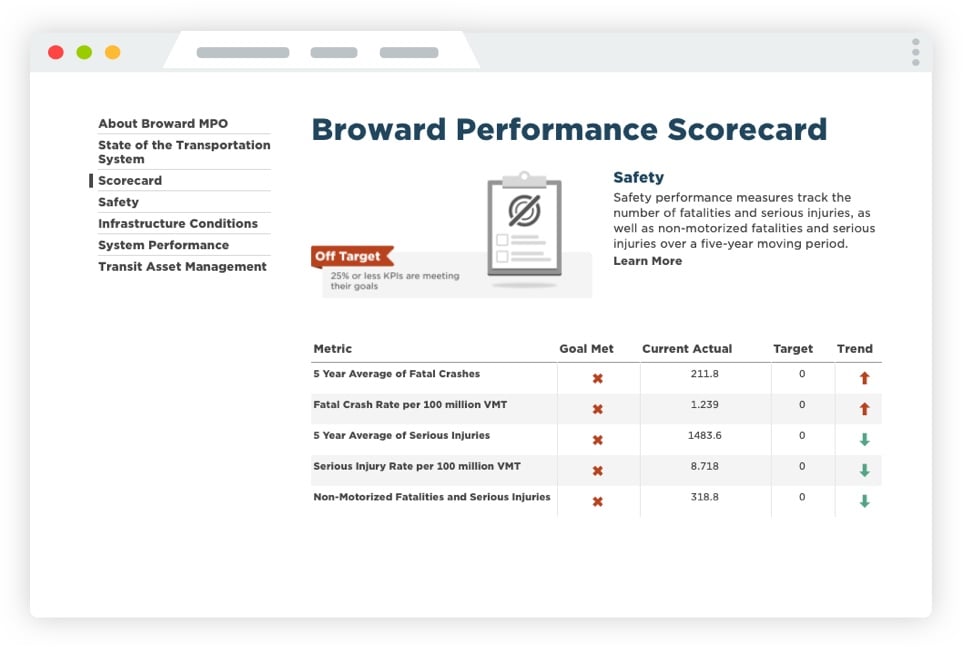
mySidewalk Broward Scorecard
Broward's Transportation Performance Management dashboard, offers an at-a-glance view of the FAST Act performance measures. Plus, a deep dive into the geospatial and trends analysis for different performance areas.

mySidewalk is honored to partner with innovative MPOs like Broward, to tell the story of how they’re making their community better.

See the Broward MPO Dashboard for yourself.

Schedule a free consultation to learn how mySidewalk can help your transportation department here

Company Name

Services we provided:

  • Lorem ipsum dolor
  • Aliquam tincidunt
  • Vestibulum auctor dapibus
  • Nunc dignissim risus

companywebsite.com